Home>Technology and Computers>How To Calculate Z-Scores In Excel
Technology and Computers
How To Calculate Z-Scores In Excel
Published: February 29, 2024
Learn how to calculate Z-scores in Excel with this comprehensive guide. Master the use of technology and computers to streamline your statistical analysis.
(Many of the links in this article redirect to a specific reviewed product. Your purchase of these products through affiliate links helps to generate commission for Noodls.com, at no extra cost. Learn more)
Table of Contents
Introduction
Calculating Z-scores is a fundamental statistical technique that allows us to standardize and compare data points from different distributions. This method is widely used in various fields, including finance, healthcare, and education, to assess the relative position of a data point within a dataset. By understanding how to calculate Z-scores in Excel, you can gain valuable insights into the significance of individual data points and make informed decisions based on their relative positions.
In this comprehensive guide, we will delve into the concept of Z-scores, explore the underlying principles, and provide a step-by-step tutorial on using the Z-score formula in Excel. Whether you are a student, a professional, or an enthusiast eager to expand your statistical knowledge, mastering the art of calculating Z-scores will undoubtedly enhance your analytical skills and empower you to extract meaningful information from complex datasets.
So, let's embark on this enlightening journey to unravel the intricacies of Z-scores and equip ourselves with the tools to leverage this powerful statistical technique in the realm of data analysis. Whether you are a novice seeking to grasp the basics or a seasoned analyst aiming to refine your expertise, this guide will serve as a valuable resource to demystify Z-scores and harness their potential in your analytical endeavors.
Understanding Z-Scores
Z-scores, also known as standard scores, are a crucial statistical tool used to assess the relative position of a data point within a dataset. They enable us to standardize and compare individual data points from different distributions, providing valuable insights into their significance and relative standing. Understanding Z-scores is essential for interpreting the relative position of a data point in relation to the mean and standard deviation of a dataset.
At its core, a Z-score measures the number of standard deviations a particular data point is from the mean of the dataset. This standardized measurement allows for a meaningful comparison of data points across different datasets, regardless of their original scales or units of measurement. By expressing data points in terms of standard deviations from the mean, Z-scores facilitate the identification of outliers and the assessment of the variability and distribution of the data.
A Z-score of 0 indicates that the data point is exactly at the mean of the distribution, while positive Z-scores signify data points above the mean and negative Z-scores indicate data points below the mean. The magnitude of the Z-score reflects the distance of the data point from the mean in terms of standard deviations, providing a clear indication of its relative position within the dataset.
In practical terms, understanding Z-scores empowers analysts to identify and evaluate the significance of individual data points within a dataset. Whether analyzing test scores, financial metrics, or physical measurements, Z-scores offer a standardized framework for comparing and interpreting data points, enabling informed decision-making and insightful observations.
By grasping the concept of Z-scores and their implications, analysts can gain a deeper understanding of the distribution of data, identify anomalies, and make meaningful comparisons across diverse datasets. This foundational knowledge forms the basis for leveraging Z-scores in statistical analysis and empowers individuals to extract valuable insights from complex datasets with confidence and precision.
Using the Z-Score Formula in Excel
Utilizing the Z-score formula in Excel empowers analysts and researchers to efficiently calculate Z-scores for individual data points within a dataset. Excel provides a versatile platform for performing complex statistical computations, and the Z-score formula can be seamlessly implemented using built-in functions, enabling users to standardize and compare data points with ease.
The Z-score formula in Excel involves two primary components: the data point to be standardized and the mean and standard deviation of the dataset. By leveraging the Z-score formula, analysts can transform raw data into standardized scores, facilitating meaningful comparisons and insightful interpretations.
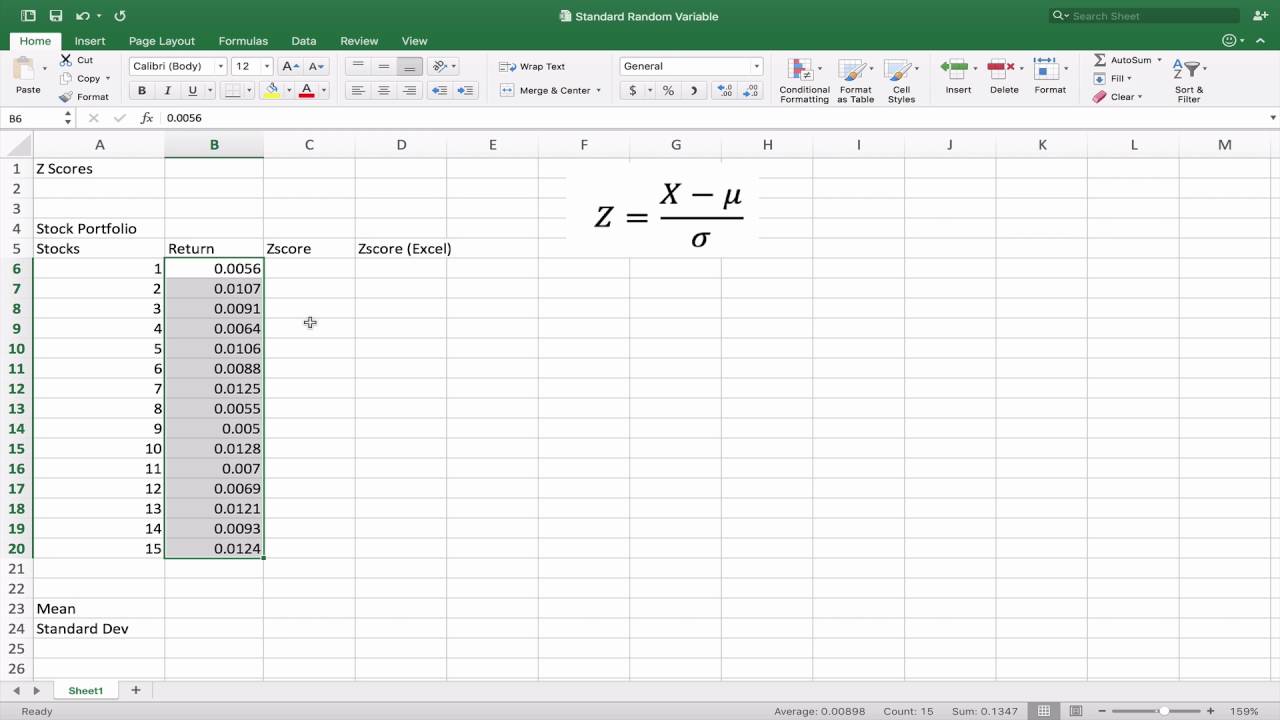
In Excel, the Z-score formula can be expressed as:
= (X – μ) / σ
Where:
- X represents the individual data point
- μ denotes the mean of the dataset
- σ signifies the standard deviation of the dataset
By applying this formula to each data point in the dataset, analysts can calculate the Z-score for every observation, providing a standardized representation of their relative positions within the distribution. Excel's formula bar serves as a dynamic platform for implementing this computation, enabling users to efficiently standardize data points and derive valuable insights from the resulting Z-scores.
Furthermore, Excel offers a range of built-in functions, such as AVERAGE and STDEV, which facilitate the calculation of the mean and standard deviation, respectively. These functions streamline the process of obtaining the necessary statistical parameters required for computing Z-scores, enhancing the efficiency and accuracy of the analysis.
In addition to the formula-based approach, Excel's data manipulation capabilities enable users to organize and manipulate datasets seamlessly, ensuring that the Z-score calculations are performed on accurate and relevant data. This flexibility empowers analysts to adapt the Z-score calculations to diverse datasets, ranging from financial data to academic performance metrics, with precision and ease.
By harnessing the power of Excel's computational capabilities and user-friendly interface, analysts can leverage the Z-score formula to standardize data points, assess their relative positions within the dataset, and derive meaningful insights with confidence and precision. This seamless integration of statistical computation within Excel empowers users to unlock the potential of Z-scores in diverse analytical contexts, facilitating informed decision-making and insightful observations based on standardized data representations.
Step-by-Step Guide to Calculating Z-Scores in Excel
Calculating Z-scores in Excel involves a systematic process that leverages the Z-score formula to standardize individual data points within a dataset. By following a step-by-step approach, analysts can efficiently compute Z-scores using Excel's built-in functions and computational capabilities, enabling them to gain valuable insights into the relative positions of data points within the distribution.
Step 1: Organize the Data
Begin by organizing the dataset in Excel, ensuring that the relevant data points are arranged in a structured format. This may involve creating a column or row dedicated to the data points for which Z-scores will be calculated. By organizing the data systematically, analysts can streamline the subsequent steps of the Z-score calculation process.
Step 2: Calculate the Mean
Utilize Excel's AVERAGE function to calculate the mean of the dataset. By selecting the range of data points and applying the AVERAGE function, analysts can obtain the arithmetic mean, which serves as a crucial parameter in the Z-score formula. The mean represents the central tendency of the dataset and is essential for standardizing the data points.
Step 3: Determine the Standard Deviation
Leverage Excel's STDEV function to determine the standard deviation of the dataset. By applying the STDEV function to the range of data points, analysts can obtain the measure of the dispersion of the data, which is vital for quantifying the variability and spread of the dataset. The standard deviation is a key component in the Z-score formula and facilitates the standardization of data points.
Step 4: Apply the Z-Score Formula
In a new column or row, apply the Z-score formula to each data point using Excel's formula bar. Utilize the formula = (X – μ) / σ, where X represents the individual data point, μ denotes the mean, and σ signifies the standard deviation. By implementing this formula for each data point, analysts can calculate the Z-scores, standardizing the data and facilitating comparative analysis.
Step 5: Interpret the Z-Scores
Once the Z-scores have been calculated, interpret their significance in the context of the dataset. A Z-score of 0 indicates that the data point is at the mean, while positive Z-scores signify data points above the mean and negative Z-scores indicate data points below the mean. The magnitude of the Z-score reflects the distance of the data point from the mean in terms of standard deviations, providing valuable insights into the relative positions of the data points within the distribution.
By following this step-by-step guide, analysts can effectively calculate Z-scores in Excel, standardize data points, and gain valuable insights into the relative positions of individual observations within the dataset. This systematic approach empowers analysts to leverage Excel's computational capabilities and streamline the Z-score calculation process, facilitating informed decision-making and insightful observations based on standardized data representations.
Interpreting Z-Scores
Interpreting Z-scores is a pivotal aspect of leveraging this statistical tool to extract meaningful insights from data. Once the Z-scores have been calculated for individual data points within a dataset, analysts can interpret their significance in the context of the distribution. Understanding how to interpret Z-scores empowers analysts to identify outliers, assess the relative positions of data points, and make informed comparisons across diverse datasets.
A Z-score of 0 signifies that the data point is exactly at the mean of the distribution. This indicates that the data point is at the center of the distribution and is precisely one standard deviation away from the mean. Positive Z-scores indicate that the data points are above the mean, with the magnitude of the Z-score reflecting the number of standard deviations the data point is above the mean. Conversely, negative Z-scores signify that the data points are below the mean, with the magnitude indicating the number of standard deviations the data point is below the mean.
The magnitude of the Z-score provides valuable insights into the relative position of a data point within the distribution. Larger positive Z-scores indicate that the data points are relatively far above the mean, while larger negative Z-scores suggest that the data points are significantly below the mean. This enables analysts to identify outliers and assess the significance of individual data points within the dataset.
Interpreting Z-scores also facilitates comparative analysis across different datasets. By standardizing data points from diverse distributions, Z-scores enable analysts to make meaningful comparisons and identify the relative positions of data points across varied contexts. This standardized framework empowers analysts to assess the significance of data points in relation to their respective distributions, facilitating cross-sectional analysis and insightful observations.
Moreover, interpreting Z-scores is instrumental in identifying anomalies and assessing the variability of data. Data points with Z-scores that deviate significantly from the mean, whether positively or negatively, warrant closer examination. These outliers may hold valuable insights or indicate potential errors in the data, highlighting the importance of interpreting Z-scores to discern the relative significance of individual observations within the dataset.
In essence, interpreting Z-scores empowers analysts to gain a nuanced understanding of the relative positions of data points within a distribution, identify outliers, and make informed comparisons across diverse datasets. This interpretative process forms the cornerstone of leveraging Z-scores to extract valuable insights from data, enabling analysts to derive meaningful observations and make informed decisions based on standardized data representations.