Home>Technology and Computers>How To Find Slope In Excel
Technology and Computers
How To Find Slope In Excel
Published: March 4, 2024
Learn how to easily calculate slope in Excel using simple formulas and functions. Master the art of finding slope in Excel with our step-by-step guide.
(Many of the links in this article redirect to a specific reviewed product. Your purchase of these products through affiliate links helps to generate commission for Noodls.com, at no extra cost. Learn more)
Table of Contents
Introduction
Understanding how to find slope in Excel is a valuable skill for anyone working with data analysis, engineering, or mathematics. Excel, a widely used spreadsheet program, offers several methods to calculate slope, making it a versatile tool for professionals and students alike.
In this article, we will explore various techniques for finding slope in Excel, including the SLOPE function, Data Analysis Toolpak, and the Trendline feature. By mastering these methods, you can efficiently analyze trends, predict future outcomes, and make informed decisions based on your data.
Whether you are a seasoned Excel user or just beginning to explore its capabilities, understanding how to find slope in Excel can significantly enhance your data analysis skills. So, let's dive into the world of slopes and discover the power of Excel in handling this fundamental mathematical concept.
Read more: How To Find Perpendicular Slope
Understanding Slope
Slope is a fundamental concept in mathematics and physics, representing the measure of the steepness of a line or a curve. In the context of data analysis, slope indicates the rate of change between two variables. Understanding slope is crucial for interpreting trends, making predictions, and drawing meaningful insights from data.
In the simplest terms, slope is calculated as the ratio of the vertical change (rise) to the horizontal change (run) between two points on a line or a curve. A positive slope indicates an upward trend, while a negative slope signifies a downward trend. A slope of zero represents a horizontal line, indicating no change between the variables.
In the realm of data analysis, understanding slope enables us to discern patterns and relationships within datasets. By calculating the slope of a line or a trend, we can determine the direction and steepness of the relationship between two variables. This insight is invaluable for making informed decisions, forecasting future trends, and identifying potential correlations within the data.
Moreover, slope plays a pivotal role in regression analysis, where it is used to fit a line or curve to a dataset, allowing us to model and predict future outcomes based on historical data. This predictive capability empowers analysts and decision-makers to anticipate trends, identify anomalies, and optimize strategies in various fields, including finance, economics, engineering, and scientific research.
In summary, understanding slope is essential for interpreting the relationship between variables, identifying trends, and making predictions based on data. By grasping the concept of slope and its significance in data analysis, individuals can harness the power of Excel to extract valuable insights and drive informed decision-making processes.
Using the SLOPE Function in Excel
The SLOPE function in Excel is a powerful tool for calculating the slope of a line based on given data points. This function is particularly useful when analyzing linear relationships between two sets of variables. By leveraging the SLOPE function, users can swiftly determine the rate of change and the direction of the relationship between the variables, providing valuable insights for data analysis and decision-making.
To use the SLOPE function in Excel, begin by selecting a cell where you want the slope value to appear. Then, input the following formula:
excel
=SLOPE(known_y's, known_x's)
Here, "known_y's" refers to the array or range of dependent variables (Y-values), while "known_x's" represents the array or range of independent variables (X-values). It's important to ensure that the two sets of data points are aligned correctly to avoid errors in the calculation.
Once the formula is entered, Excel will compute the slope of the linear regression line that best fits the given data points. The resulting value represents the rate of change between the variables, indicating the steepness and direction of the relationship.
For instance, if analyzing sales revenue (Y) against advertising expenditure (X), the SLOPE function can reveal the impact of each additional dollar spent on advertising in relation to the increase in revenue. This insight is invaluable for optimizing marketing strategies, budget allocation, and revenue forecasting.
Moreover, the SLOPE function can be applied to various scenarios, such as analyzing stock prices against time, examining the correlation between temperature and energy consumption, or evaluating the relationship between test scores and study hours. By utilizing the SLOPE function, users can gain a deeper understanding of the underlying trends and dynamics within their datasets.
In summary, the SLOPE function in Excel empowers users to efficiently calculate the slope of a line, providing crucial insights into the relationship between variables. Whether for business analysis, scientific research, or academic purposes, mastering the SLOPE function equips individuals with a valuable tool for extracting meaningful insights from data and making informed decisions.
Calculating Slope Using Data Analysis Toolpak
In Excel, the Data Analysis Toolpak is a powerful add-in that offers a wide range of statistical and data analysis tools, including the ability to calculate the slope of a line based on given data points. This feature is particularly beneficial for users who require advanced statistical functions and regression analysis capabilities within the Excel environment.
To utilize the Data Analysis Toolpak for calculating slope, users must first ensure that the Toolpak is installed. If not already enabled, the Toolpak can be activated by navigating to the "Data" tab, selecting "Data Analysis" from the "Analysis" group, and then choosing "Regression" from the list of available tools.
Once the Data Analysis Toolpak is activated, users can proceed to calculate the slope by following these steps:
-
Prepare the Data: Organize the dataset with the independent variable (X-values) and the dependent variable (Y-values) in separate columns. Ensure that the data is arranged in a tabular format, with each column representing a distinct variable.
-
Access the Regression Tool: After selecting the "Regression" option from the Data Analysis Toolpak, a dialog box will appear, prompting users to input the required parameters for the regression analysis. Here, users should specify the input range for the Y-values and X-values, as well as the output location for the regression results.
-
Configure the Regression Options: Within the regression dialog box, users can customize additional options based on their analysis requirements. This includes specifying whether to include labels, confidence levels, and residual outputs, among other settings.
-
Generate the Regression Output: Upon configuring the desired options, users can initiate the regression analysis, which will generate a comprehensive output containing various statistical measures, including the calculated slope of the regression line.
By leveraging the Data Analysis Toolpak, users can seamlessly calculate the slope of a line and obtain a wealth of additional statistical insights, such as the coefficient of determination, standard error, and significance levels. This comprehensive analysis equips users with a deeper understanding of the relationship between variables, enabling them to make informed decisions and predictions based on the data.
In summary, the Data Analysis Toolpak in Excel provides a robust platform for performing regression analysis and calculating the slope of a line. By harnessing the advanced statistical capabilities offered by the Toolpak, users can elevate their data analysis endeavors and derive valuable insights from their datasets, ultimately enhancing their decision-making processes and analytical capabilities.
Using the Trendline Feature in Excel
The Trendline feature in Excel offers a user-friendly and visually intuitive method for analyzing and visualizing trends within datasets. By applying a trendline to a scatter plot or line chart, users can effortlessly identify the underlying patterns and relationships between variables, providing valuable insights for data analysis and decision-making.
To utilize the Trendline feature in Excel, users can follow these steps:
-
Create a Scatter Plot or Line Chart: Begin by organizing the dataset and creating a scatter plot or line chart to visualize the relationship between the variables. This can be achieved by selecting the data points and choosing the appropriate chart type from the "Insert" tab.
-
Add a Trendline: Once the chart is created, users can add a trendline by right-clicking on a data series within the chart and selecting "Add Trendline" from the context menu. This action opens a dialog box with various trendline options.
-
Select the Trendline Type: In the trendline options dialog box, users can choose from different trendline types, including linear, exponential, logarithmic, polynomial, and power trendlines. Each type is suited for different data patterns, allowing users to select the most appropriate trendline for their analysis.
-
Customize the Trendline: After selecting the trendline type, users can further customize the trendline by adjusting parameters such as intercepts, forecasting, and display options. These customizations enable users to tailor the trendline to their specific analysis requirements.
-
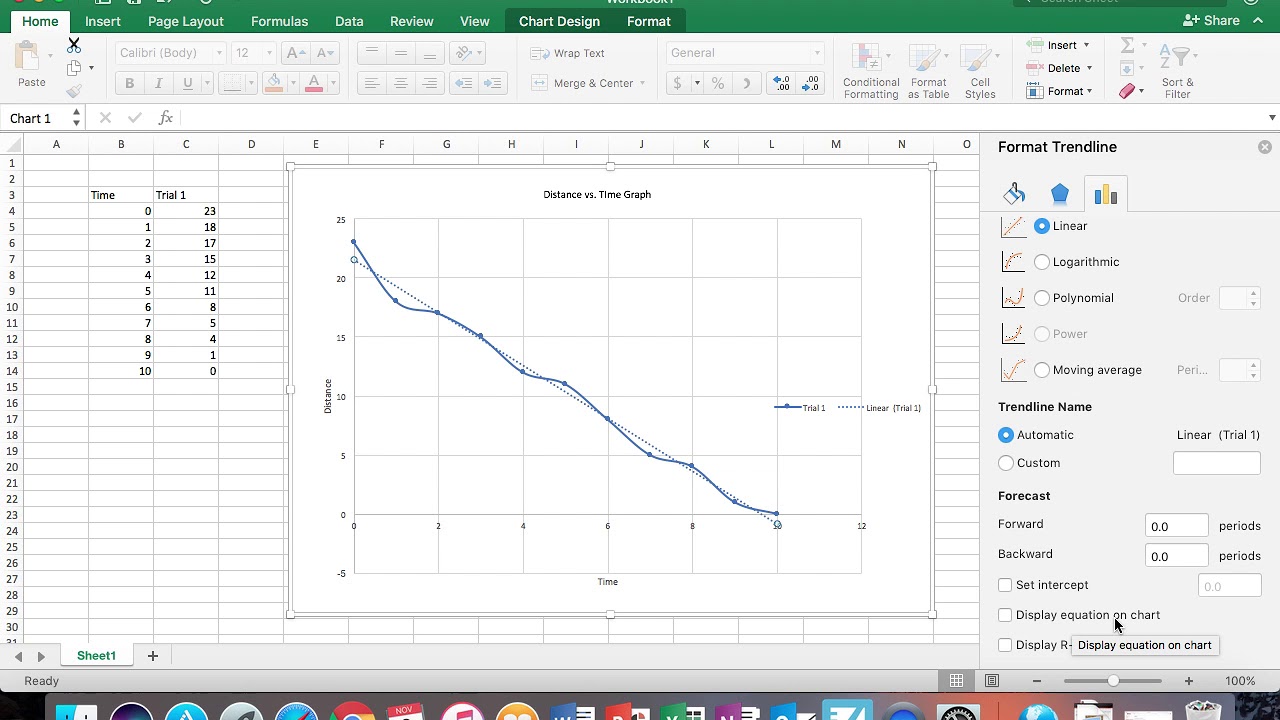
Display the Equation and R-Squared Value: Upon adding the trendline, Excel provides the option to display the equation of the trendline and the coefficient of determination (R-squared value) on the chart. These details offer valuable insights into the strength and nature of the relationship between the variables.
By leveraging the Trendline feature in Excel, users can visually assess the trends within their datasets, identify potential correlations, and make informed decisions based on the observed patterns. Whether analyzing sales trends, market fluctuations, or scientific data, the Trendline feature empowers users to gain deeper insights into the dynamics of their datasets.
In summary, the Trendline feature in Excel serves as a valuable tool for visualizing and analyzing trends within datasets. By seamlessly integrating trendlines into charts, users can uncover meaningful insights, identify patterns, and make informed decisions based on the observed relationships between variables.
Read more: How To Find Slope From A Table
Conclusion
In conclusion, mastering the techniques for finding slope in Excel equips individuals with powerful tools for extracting valuable insights from data and making informed decisions. Whether using the SLOPE function, Data Analysis Toolpak, or the Trendline feature, Excel offers a versatile platform for analyzing trends, identifying correlations, and predicting future outcomes based on data.
By understanding the concept of slope and its significance in data analysis, users can effectively interpret the relationships between variables, discern patterns, and make informed predictions. The ability to calculate slope in Excel is particularly beneficial for professionals in fields such as finance, engineering, scientific research, and business analysis, where data-driven decision-making is paramount.
The SLOPE function provides a straightforward method for calculating the slope of a line, enabling users to swiftly determine the rate of change and the direction of the relationship between variables. This capability is invaluable for analyzing linear relationships, identifying trends, and optimizing strategies based on data insights.
Moreover, the Data Analysis Toolpak offers advanced statistical capabilities, allowing users to perform regression analysis and obtain comprehensive insights into the relationships within their datasets. By leveraging the Toolpak, users can calculate the slope of a line and gain a deeper understanding of the statistical measures associated with the regression analysis.
Additionally, the Trendline feature in Excel provides a visually intuitive approach to analyzing trends within datasets. By adding trendlines to charts, users can visually assess the relationships between variables, identify patterns, and make data-driven decisions based on the observed trends.
In essence, the ability to find slope in Excel empowers individuals to unlock the potential of their data, enabling them to make informed decisions, identify opportunities, and optimize strategies based on the insights derived from their analyses. Whether for academic, professional, or research purposes, mastering the techniques for finding slope in Excel is a valuable skill that enhances data analysis capabilities and drives informed decision-making processes.